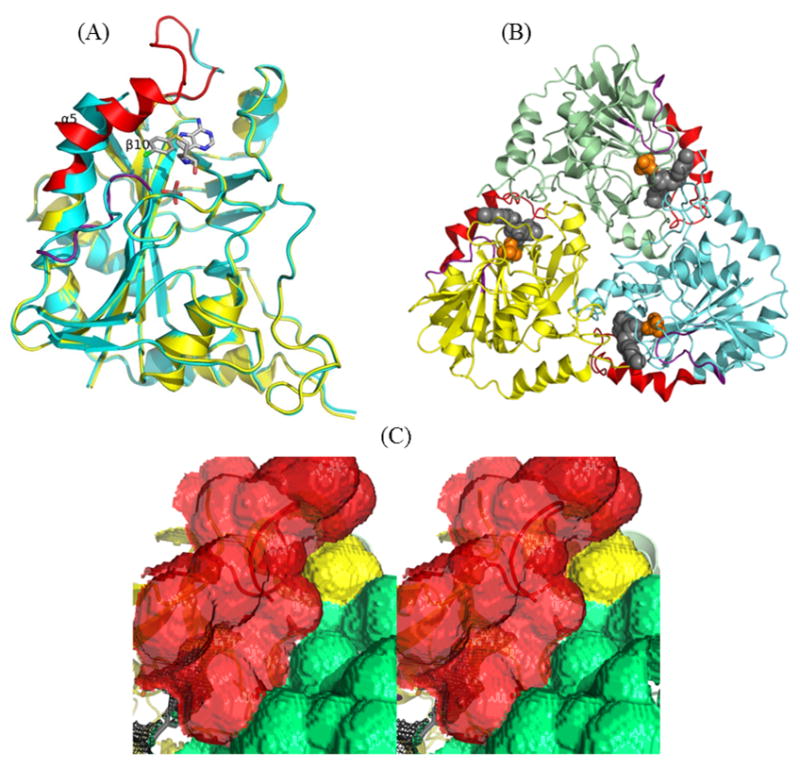
Figure 8.

(A) The superimposed structures of apo (cyan) and p-Cl-PhT-DADMe-ImmA liganded (yellow) MTAP. The region from Thr219 to Asn245 and the loop of Gly16 to Glu24 of liganded MTAP are highlighted in red and purple, respectively, to emphasis the conformational difference. (B) The monomers of trimeric MTAP in complex with ligand are shown in cyan, green and yellow. The region from Thr219 to Asn245 and the loop of Gly16 to Glu24 of liganded MTAP are highlighted in red and purple, respectively. The p-Cl-PhT-DADMe-ImmA (gray) and phosphate (orange) included as space-filling models. (C) The cross-eyed stereoview of the solvent accessible surface of inhibitor bound MTAP highlighted via a Connolly surface (the molecular surface is generated using 1.4 A probe). The surface contributed from a protomer, the region from Thr219 to Asn245 and the adjacent subunit are colored in yellow, red and green, respectively. The enclosed active site pocket is drawn as black mesh.
