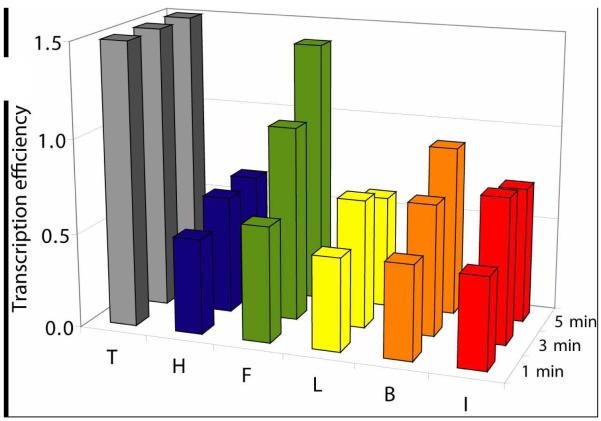
Figure 5.
Comparison of the transcription efficiencies of insertion between different DNA templates (X=T, H, F, L, B, and I) during the initial phase of transcription at low product conversion. Data obtained from equation (1) where m=N’-1. Bars for T are truncated, actual values being 10.1 at 1 min, 9.6 at 3 min, and 10.0 at 5 min. Reaction time noted on the right (1, 3, and 5 min).

