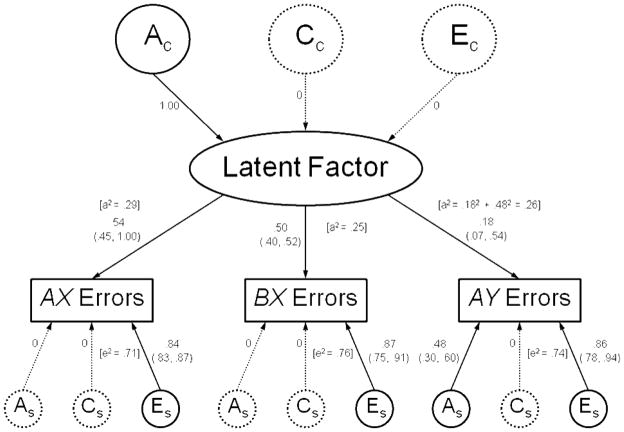
Figure 3.
Common pathways model for AX, BX, and AY errors. Standardized parameter estimates with 95% confidence intervals are shown. To simplify the display, only one twin is represented in the diagram. A=Additive genetic influences; C=Common environmental influences; E=Unique environmental influences; a2=Proportion of variance accounted for by additive genetic influences (heritability); e2=Proportion of variance accounted for by unique environmental influences. Subscript C=Influences that are common to all three trial types. Subscript S=Influences that are specific to a particular trial type. Dotted lines represent variance components that were very small and could be dropped from the model without any significant reduction in fit.
*p<.05

