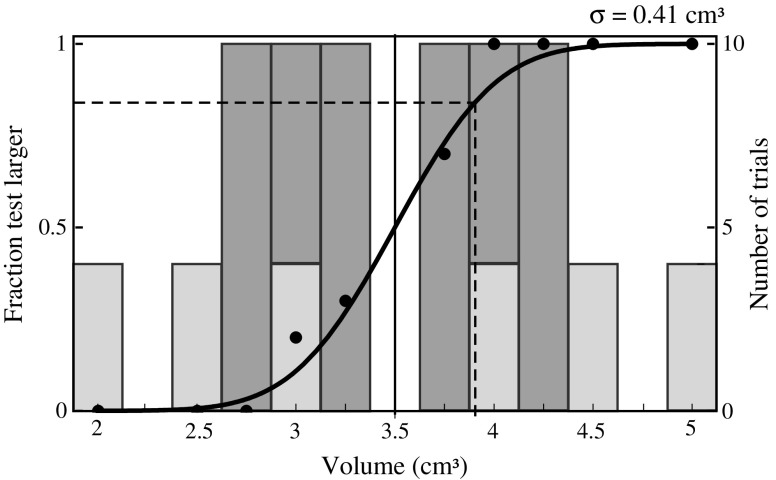
Fig. 2.
An example of data collected for a small reference, for which the the second part used a narrower range. The bar chart shows the number of repetitions for each test volume (right scale). The light-gray bars indicate the trials from the first part of the data collection procedure. The dark-gray bars indicate the trials from the second part. The curve shows the fitted function through the measured data points (left scale). The vertical line at 3.5 cm3 indicates the volume of the reference stimulus. The dashed line specifies the place of the 84% threshold. The value of this discrimination threshold, σ, is shown in the right top corner of the figure. If the range in the first and second parts was kept the same, the data points would be only at the positions indicated by the light-gray bars, and all those points would be measured 10 times

