
Fig. 3.
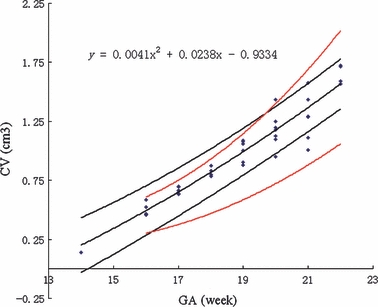
Cerebellar volume (CV) vs. gestational age (GA). The figure shows CV in cm3 as a function of GA in weeks. Each symbol represents the CV for a single fetus. The central dark line represents the mathematical model of the data, the equation for which is shown in the top left corner. The outer dark lines represent the 90% confidence intervals. The outer red lines are the 95th and 5th percentiles for CV derived from the study by Hatab et al.