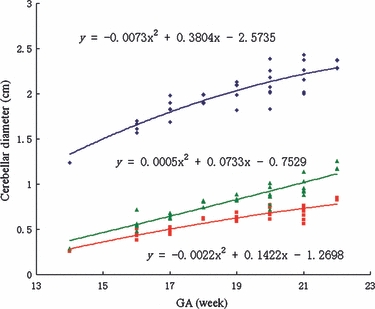
Fig. 4.

TCD, vermis height and vermis width vs. gestational age (GA). The figure shows TCD in cm (□, blue symbol), vermis height in cm (▴, green symbol) and vermis width in cm (▪, red symbol) as a function of GA in weeks. The three lines represent the mathematical models of the data, the equations for which are marked on the figure.
