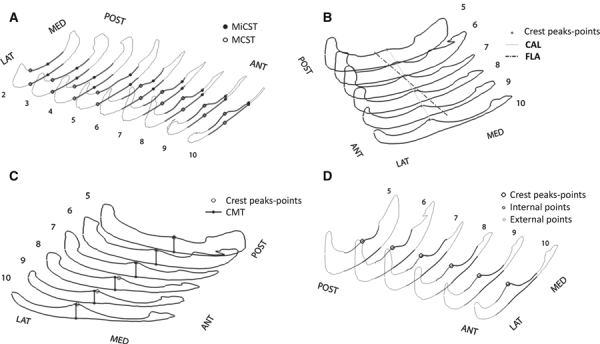
Fig. 6.

HFP qualitative data. (A) Localization of the points defining maximum and minimum coronal section thicknesses (MCST and MiCST). (B) Representation of the crest approximating line (CAL) with respect to the foot longitudinal axis (FLA). (C) Representation of the points defining the crest maximal thickness (CMT) with respect to the points of the crest peaks. (D) Measurement of the HFP thickness on the internal and external sides.
