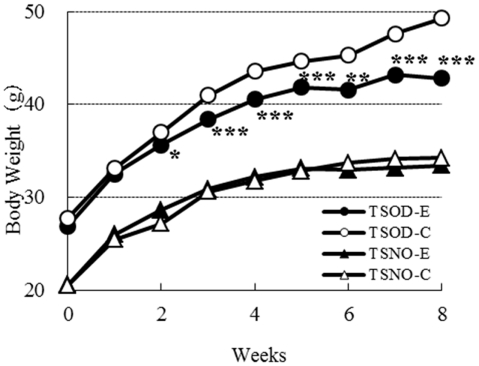
Figure 1.
Comparisons of body weights. Closed circles, open circles, closed triangles, and open triangles denote TSOD-E, TSOD-C, TSNO-E, and TSNO-C respectively. Asterisks indicate statistical significance between Experimental group and Control group on TSOD; one, two, and three asterisks indicate the p value less than 0.05, 0.01, and 0.005, respectively.

