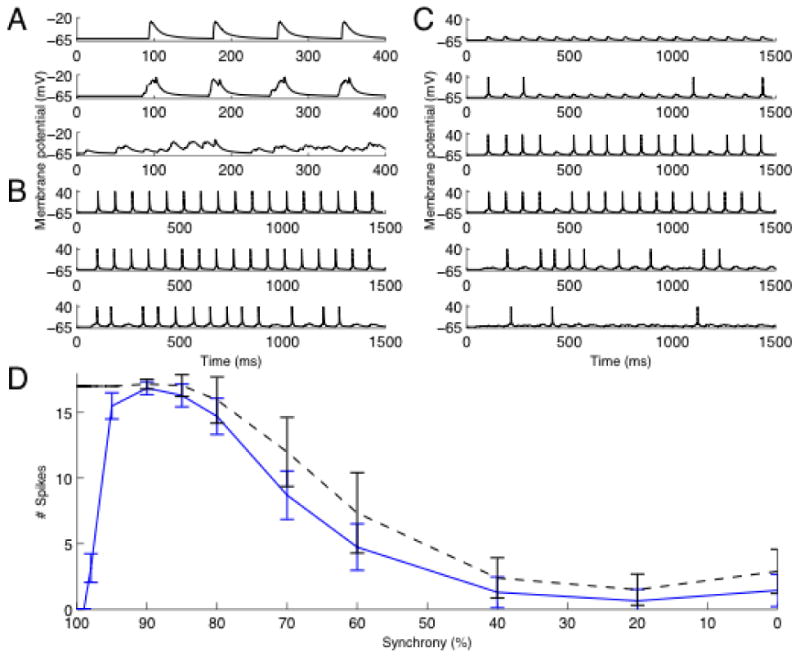
Fig 1.

Differential suppression of synchronous input. A. Synaptic input. The figure shows from top the membrane potential at input site with 100%, 90% and independent input respectively. B. The membrane potential in the soma without KA present. The graphs shows from top simulations with 100%, 90% and 70% synchronous input. C. Membrane potential in soma with KA present. The graphs shows from top the simulation with 100%, 98%, 95%, 90%, 70%, and 40 % synchronous input. D. Synchronized input is strongly suppressed by KA. The figure shows the number of spikes produced for different synchronicity levels. The black line represents baseline (control without KA) and the blue line with KA present. Note the pronounced suppression in the interval 100-90%.
