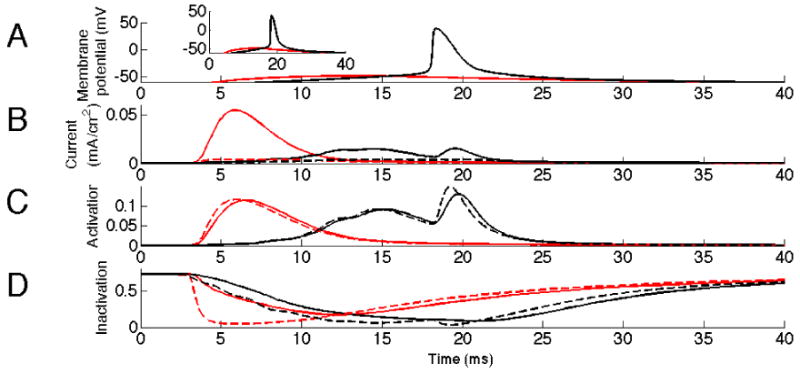
Fig. 2.

Activation of KA by synchronized versus semi-synchronized input. Synchronous input (100%), in red, activates KA more than semi- synchronous input (80%), in black. The dashed lines represent values of KA steady-state activation and inactivation at the membrane potentials dictated by A. A: Membrane potential in the soma. Inset shows initial slope of EPSP more clearly. B: Current through KA at input site. Note the difference in current around 6 ms. C: Inactivation of KA at input site. The interval 2-10 ms shows that the effect seen in B originates from the dynamics aspects of KA. D: Activation of KA at input site. Note the difference in inactivation around time of input 2-10ms.
