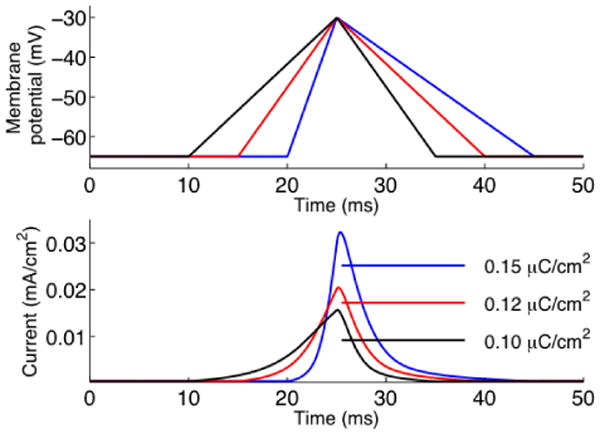
Fig. 3.

Sensitivity to voltage slope. The top graph shows voltage clamp command of different initial slope but same area. The bottom graph shows the corresponding current through the KA channel. Note the difference in the peak current at 25 ms. The legend indicates the integral of the current for each protocol.
