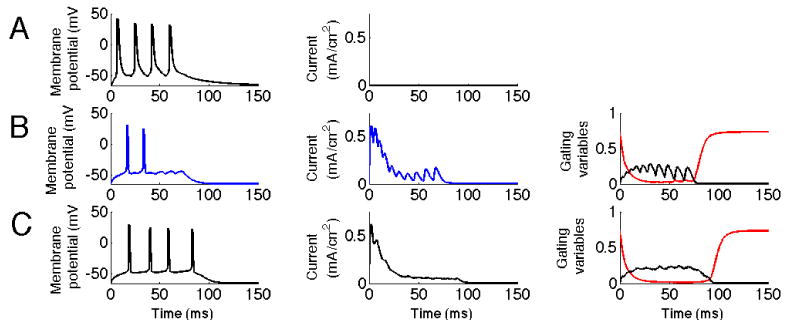
Fig. 6.

KA reduces response to fast ripple input. The first column represents the membrane potential of the soma. The second column represents the current through the KA channel measured at the location of the synaptic input. The third column represents the gating variables of the KA channel. The black line represents activation and the red line inactivation. A. Fast ripple with no KA present. Input represents higher synchronicity levels present during high potassium concentration conditions. B. Fast ripple with KA present. Note the reduction in number of action potentials generated due to the increase in KA current. The plot of gating variables show that this input leads to a larger degree of activation, particularly at its peaks and to a lesser degree of inactivation, particularly for later inputs. C. Control input representing lower synchronicity present in control concentration of potassium.
