
Figure 1. Genetic patterning of the human cortex based on genetic correlations from the hypothesis-driven seed-based approach.
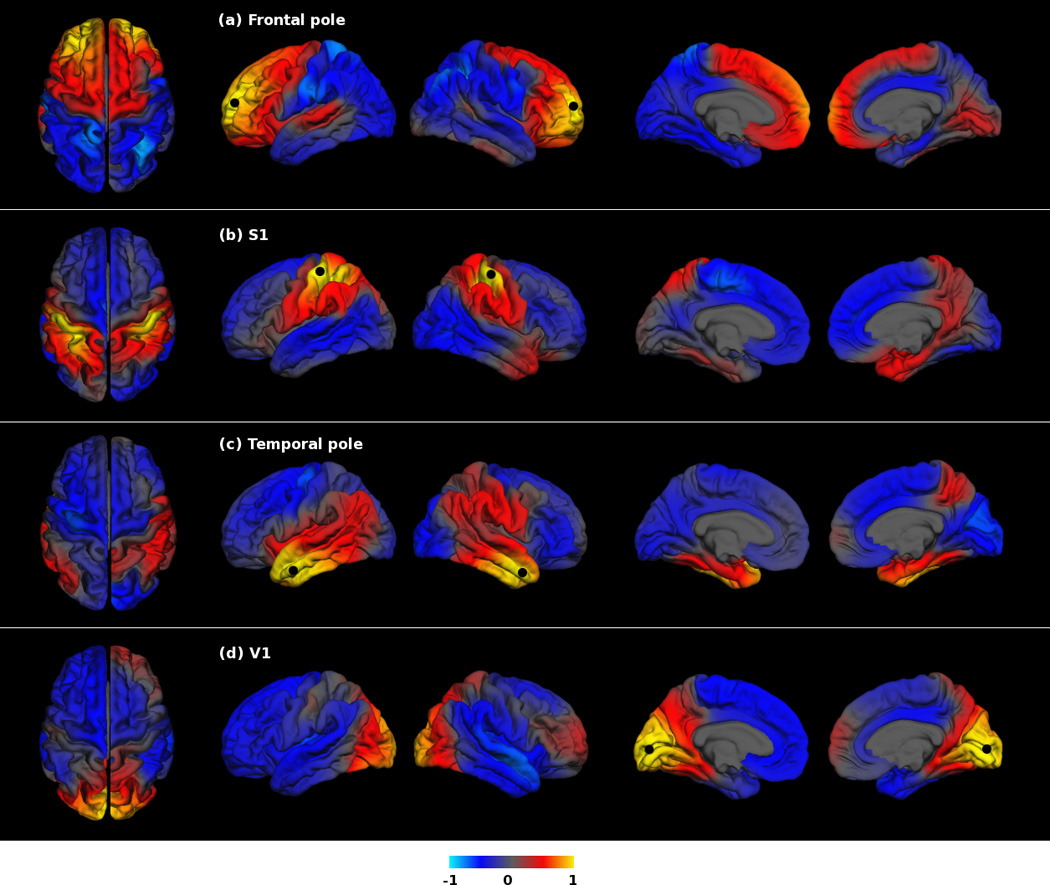
Genetic correlation maps with black dots indicating the frontal pole, S1, temporal pole and V1 seed regions. From left to right, the columns show the following views: superior, left hemisphere lateral, right hemisphere lateral, left hemisphere medial, right hemisphere medial. Color scale indicates the strength of genetic correlations between the surface area at the seed region and at all other locations on the cortical surface; these correlations range from positive to negative.