
Figure 2. A grid placement of genetic correlation maps from 34 different seeds.
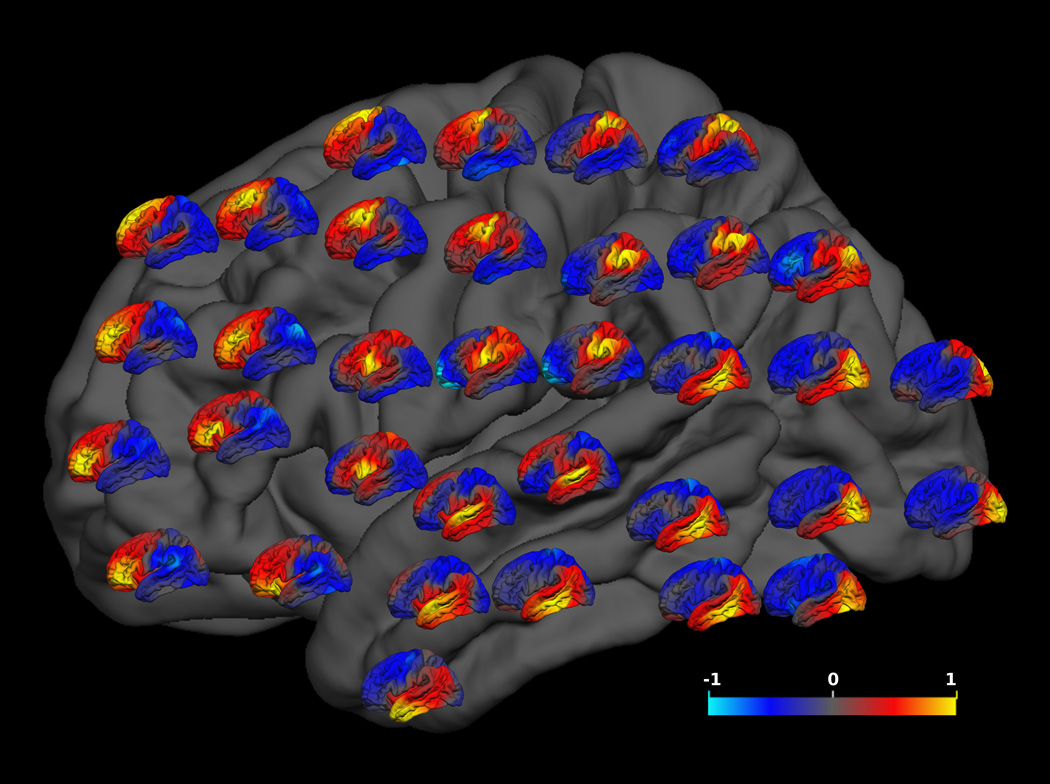
The location of each small genetic correlation map on the grey brain map represents the location of the seed for that correlation map. Conventions as in Figure 2
Official websites use .gov
A
.gov website belongs to an official
government organization in the United States.
Secure .gov websites use HTTPS
A lock (
) or https:// means you've safely
connected to the .gov website. Share sensitive
information only on official, secure websites.
The location of each small genetic correlation map on the grey brain map represents the location of the seed for that correlation map. Conventions as in Figure 2