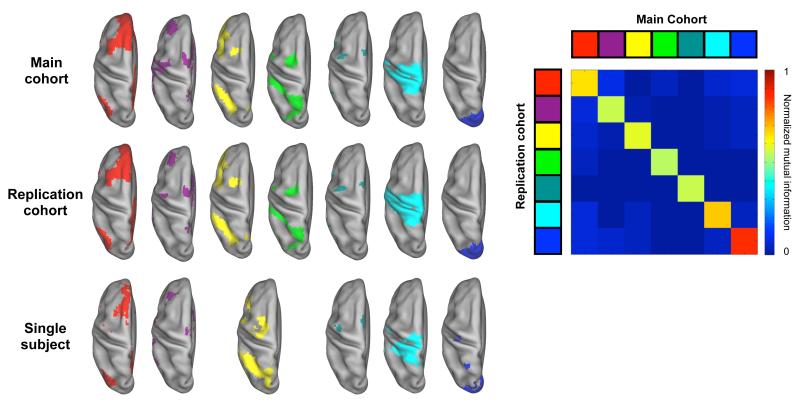
Figure 2. Many modified voxelwise subgraphs replicate across cohorts and even within single subjects.
Select subgraphs from the modified voxelwise analysis are presented from a dorsal view for both cohorts and for an additional single subject. Cohort subgraphs are taken from the 2% tie density analysis and subgraphs in the individual are taken from a 0.5% tie density analysis. The overall NMI between cohort assignments at this threshold was 0.71, and NMI values between subgraphs from different cohorts are shown in the matrix to the right. Additional views of this data and replications of subgraphs from other thresholds are found in Figure S3.

