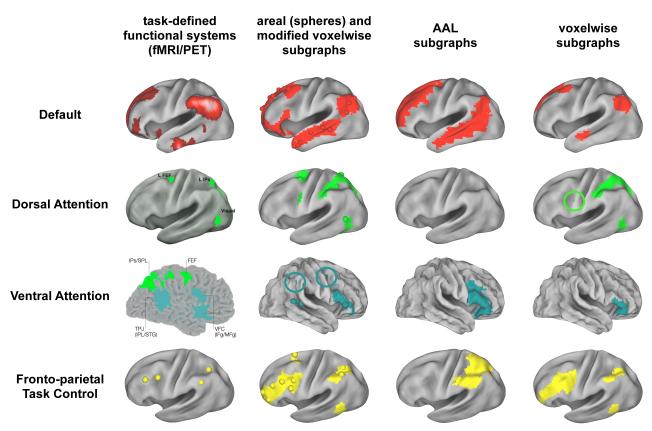
Figure 3. Graph definition dictates fidelity to functional brain organization.
At left, the task-defined locations of four established functional systems. The next three columns display, for the main cohort, the single subgraph that best corresponds to each functional system under the four graph definitions. Circles are placed around small portions of subgraphs that might otherwise be overlooked (there are small green regions within green circles). Data from a single threshold tailored to each graph are shown. The threshold was the next-to-highest threshold that each graph can achieve before the graph becomes severely fragmented (defined by the giant component containing fewer than 50% of the nodes in the graph). Tailored thresholds were 3% for the areal graph, 5% for the AAL-based graph, and 2% for both voxel-based graphs. Correspondence between these functional systems and subgraphs is good for the areal and modified voxelwise graphs, intermediate for the voxelwise graph, and poor for the AAL-based graph. Note especially the correspondence between areal (spheres) and modified voxelwise (surface) subgraphs, despite great differences in network size (N = 264 vs N = 40,100). See Figure S4 and S5 for more comprehensive and quantitative presentations of subgraph assignments. Images in the left column are modified from (Corbetta et al., 2008; Corbetta and Shulman, 2002; Dosenbach et al., 2007; Shulman et al., 1997).

