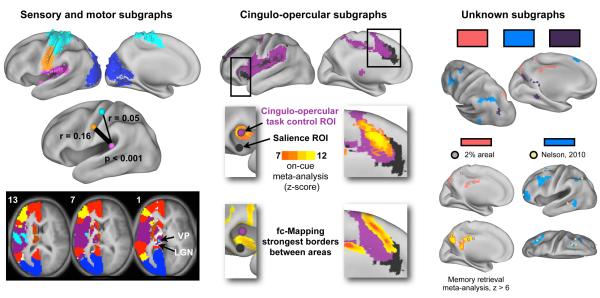
Figure 4. Subgraph identities.
Left: Visual (blue), auditory (pink), and hand (cyan) and face (orange) sensory-somatomotor (SSM) subgraphs are shown for the areal network at 2% (spheres) and the modified voxelwise network at 0.5% tie density (surface). Below, the mean correlations in the main cohort between auditory processing (pink, MNI: −38 −33 17) and hand (cyan, −40 −19 54) and face (orange, −49 −11 35) regions are shown. Auditory-face correlations are significantly higher than auditory-hand correlations in both cohorts (p < 0.001, two-sample two-tail t-test). Bottom, slices from the 4% tie density modified voxelwise analysis, with labels on relevant thalamic nuclei (numbers are z coordinates). Middle: Two cingulo-opercular subgraphs shown from the 3% areal (spheres) and 2% tie density modified voxelwise analysis (surface). Middle, published ROIs (cingulo-opercular task control: (Dosenbach et al., 2007); salience: (Seeley et al., 2007)) or modified voxelwise subgraphs, with an overlaid heat map of on-cue meta-analysis activation. On-cue activity localizes to the purple subgraph. Bottom, very strong fc-Mapping gradients are displayed separating the black and purple subgraphs, indicating that they possess distinct rs-fcMRI signals. Right: At top, three unknown subgraphs from the 0.5% tie density modified voxelwise analyses are shown. The salmon subgraph (gray in all other figures, here salmon for contrast) is reproduced with a 2% areal subgraph overlaid as spheres, and the strongest activations from the memory retrieval meta-analysis are shown below. The light blue subgraph is also reproduced and the coordinates of a putative functional system from (Nelson et al., 2010a) are overlaid as tan spheres.

