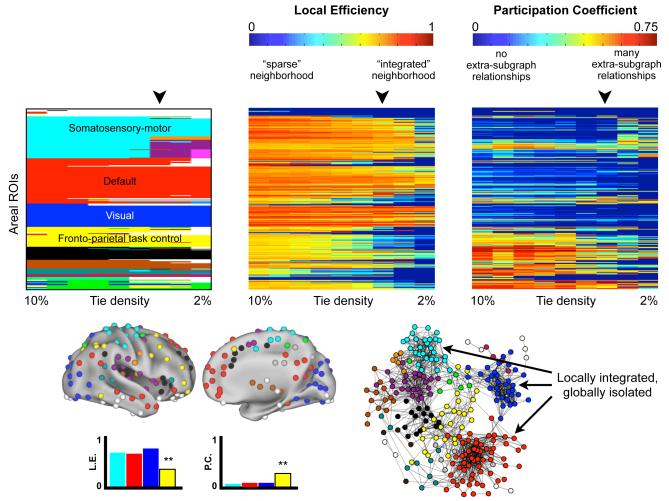
Figure 6. Default, visual, and somatosensory-motor systems are well-integrated on local scales but are relatively isolated in relation to other functional systems.
At top, the subgraphs, local efficiencies, and participation coefficients for all nodes in the areal network over a range of thresholds are shown. The local efficiency of each node indicates the extent to which a node is embedded in a richly connected local environment. High (hot color) values indicate a richly connected local environment. The participation coefficient of each node indicates the extent to which a node has ties to other subgraphs. Here, low (cool color) values indicate that nodes are connected almost exclusively to members of their own subgraph. One-factor ANOVAs indicate a significant effect of subgraph at all thresholds for both indices (all with p < 10−6), and post-hoc t-tests indicate that the cyan, blue, and red subgraphs have significantly higher local efficiencies and lower participation coefficients at most or all thresholds than the yellow subgraph. Node assignments for a single threshold (4% tie density) are shown on a brain and in a spring embedded layout, and the local efficiencies and participation coefficients of relevant subgraphs at this threshold are shown. Note that local efficiency is independent of subgraph assignment, whereas participation coefficients depend upon subgraph assignment.

