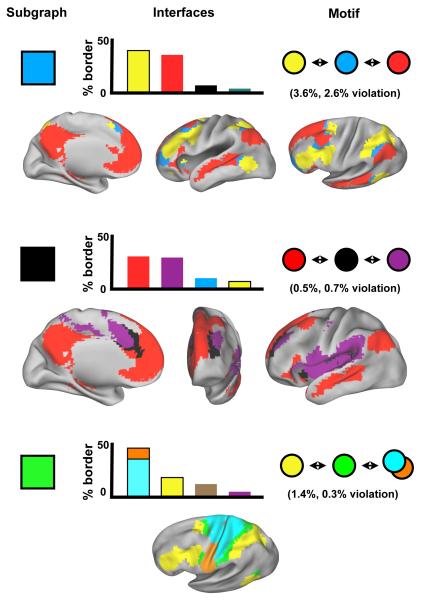
Figure 7. Functional systems are arranged into topological motifs across the cortex.
In charts, particular subgraphs at a single threshold are selected, the spatial boundaries of that subgraph are found, and the distribution of spatial interfaces (en face voxels) to other subgraphs are calculated. The most frequent interfaces are plotted as percents of the total subgraph interface volume. Motifs are inferred by finding instances where subgraphs interfacing with a subgraph are themselves very unlikely to interface. For instance, in the top chart, the light blue subgraph interfaces most frequently with the yellow and red subgraphs, but red is only 3.6% of yellow’s interface, and yellow is only 2.6% of red’s interface. Below each chart, plots of relevant subgraphs on brain surfaces visually demonstrate the repeated spatial patterns of subgraphs. Data from the modified voxelwise analysis at 1% tie density in the replication cohort are presented.

