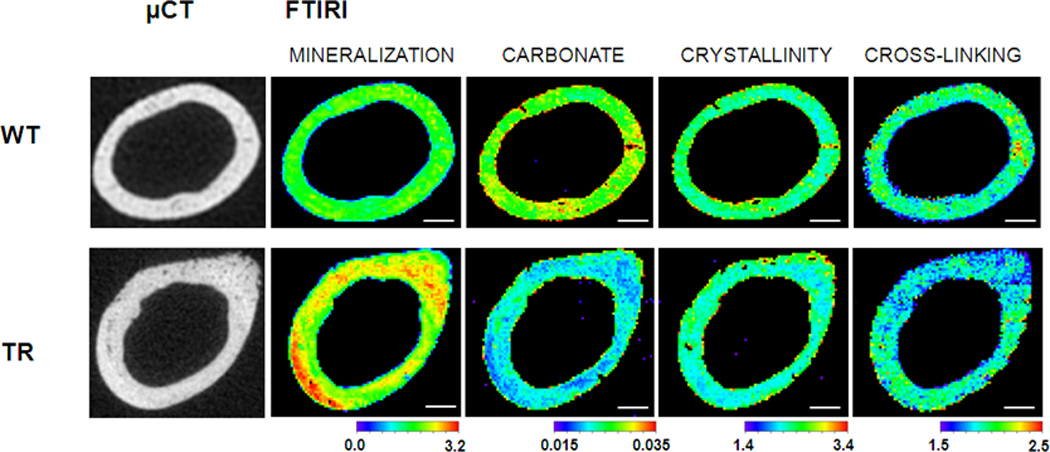
Figure 4.

μCT and FTIRI images. Examples of μCT cross-sections of wild type (WT) and transgenic (TR) femurs with respective FTIRI images, including mineralization, carbonate substitution, mineral crystallinity, and collagen cross-linking.
Scale bar is 200 microns.
Mineralization range: 0 – 3.2
Carbonate range: 0.015 – 0.035
Crystallinity range: 1.4 – 3.4
Cross-linking range: 1.5 – 2.5
