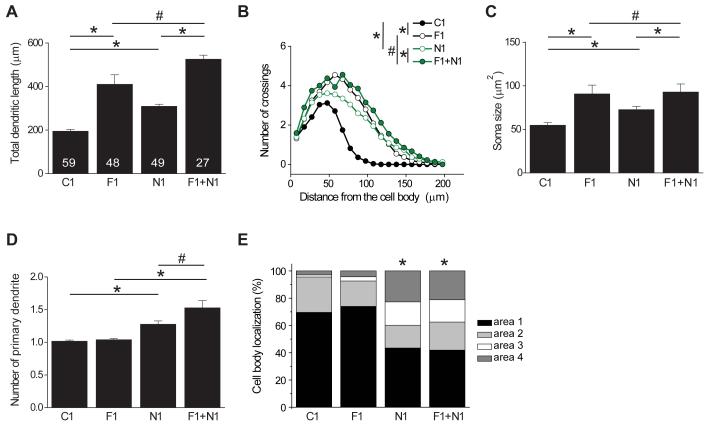
Figure 4. Lack of functional interaction between FEZ1 and NDEL1 in regulating development of newborn neurons in the adult brain.
Summary of total dendritic length (A), Sholl analysis of dendritic complexity (B), soma size (C), number of primary dendrites (D), and distribution of cell body position within different domains (E, as defined in Figure 1B).of newborn neuron in the adult brain expressing shRNA-control (C1), shRNA-FEZ1#1 (F1), shRNA-NDEL1 (N1), or co-expressing F1 and N1 (F1 + N1), at 14 dpi. The same group of cells for C1 and F1 as in Figure 1 were plotted for comparison. Values represent mean ± SEM (*: P < 0.01; #: P > 0.05; ANOVA).

