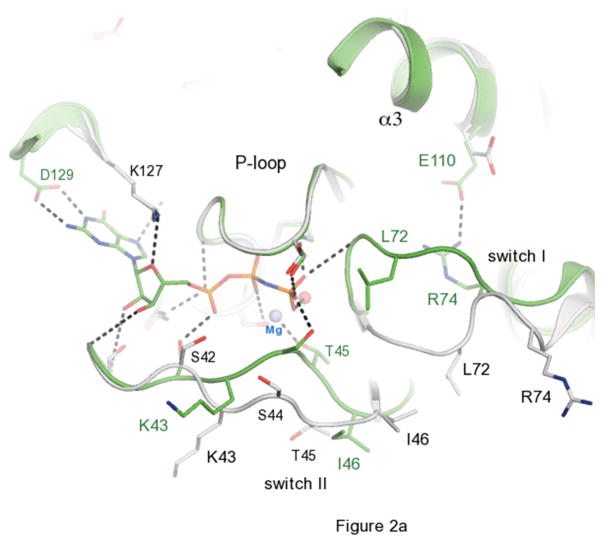
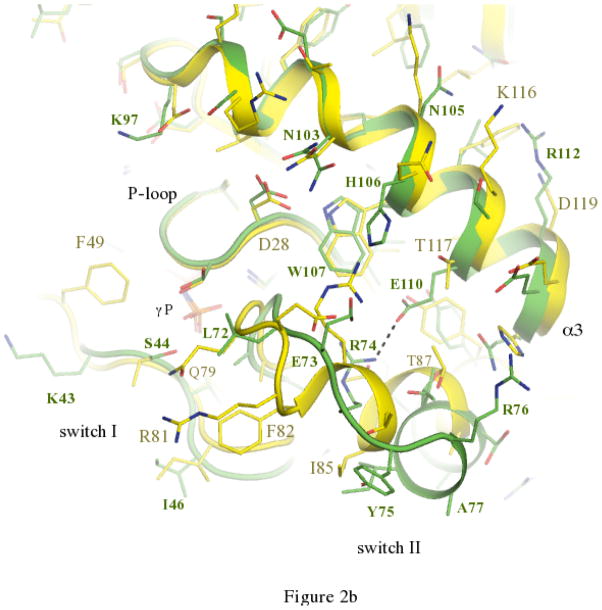
Figure 2.
The activation cycle of Ypt32. (a) Comparisons of active and inactive conformations of Ypt32. Side chains of key residues in switch regions are shown as ball and stick – all other segments are represented as cartoon. Ypt32(GTP) is green, and Ypt32(GDP) is grey. The hydrogen bond between γ-phosphate and the backbone NH of Gly71 is shown. (b) Structural comparisons of active Ypt32 and Sec4 at the switch regions. Ypt32 is green, and Sec4 is yellow. The black dashes show the salt bridge between Arg74 and Glu110 in Ypt32. The side chain of Thr79 (Ypt32) is modeled in two conformational states. Similarly, Asn103 (Ypt32) displays side chain flexibility.


