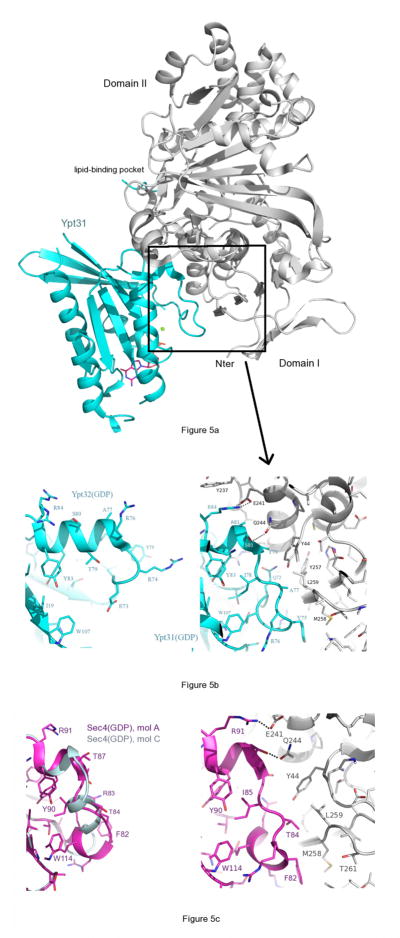
Figure 5.
GDI-mediated remodeling of the switch II helix of Ypt32(GDP). GDI is coloured gray in all figures. (a) Structure of Ypt31/GDI generated from PDB file 3cpj. The Rab-binding platform (RBP) is indicated by the rectangle. The lipid-binding pocket is behind GDI in this view. (b) Left panel, uncomplexed Ypt32(GDP); right panel, the complex Ypt31(GDP)/GDI, which corresponds to the region indicated by the rectangle. The two panels are shown with the same view and scale, thus emphasizing the loss of a helical turn in switch II upon binding of GDI. Arg84 (left panel) is observed in two conformations, and becomes ordered upon forming a salt bridge with Glu241 (GDI). A hydrogen bond is also shown between Q244 and the backbone NH of Ser80 (Ypt32). (c) Uncomplexed Sec4(GDP) is shown on the left panel (magenta, molecule A; light blue, molecule C), and as the complex Sec4/GDI (right panel, PDB code 3cph). The side chains of molecule C are not shown, for clarity. Structural alignments were performed as described in section 2.3 of Materials and Methods.

