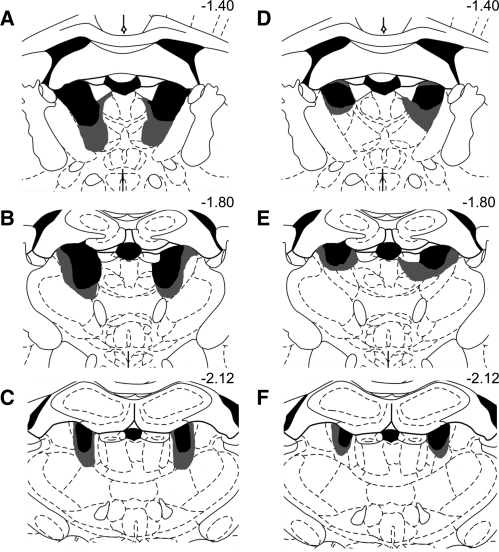
Figure 1.
Series of coronal illustrations depicting anterior thalamic cell loss in the smallest (black) and largest (gray) lesion. Lesions are shown in both the complete AT lesion (A–C on the left) and partial AT lesion (D–F on the right). The series distance from bregma is reported numerically in millimeters. Note that damage is largely restricted to AT nuclei. Also note that in the ATN partial lesion condition, damage to the AVVL was unilateral in ∼40% of the cases.

