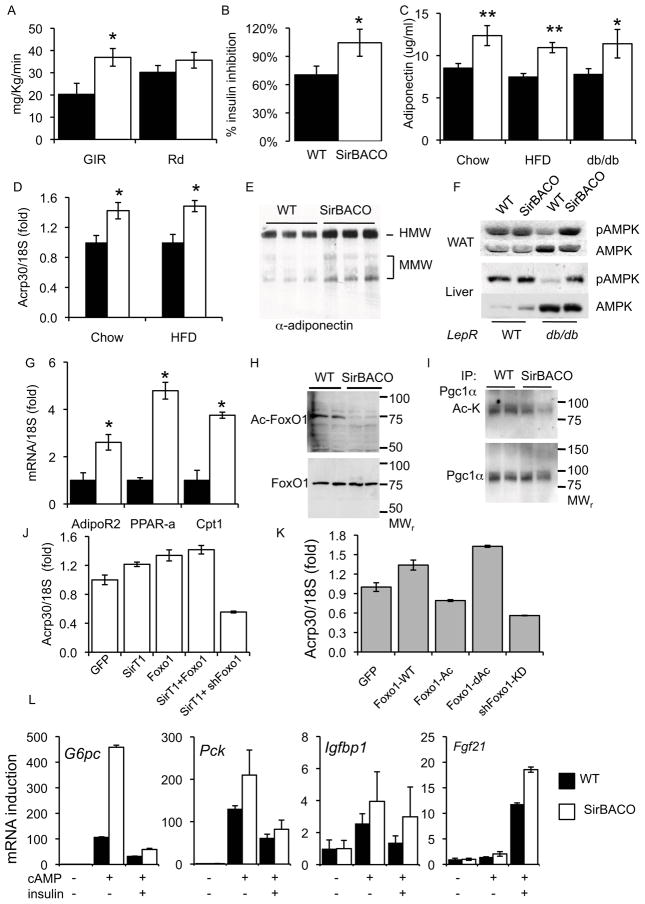
Figure 4. SirT1 decreases HGP and regulates adiponectin.
(A) Glucose infusion (GIR) and disappearance rates (Rd) and (B) Insulin suppression of hepatic glucose production (HGP) in high fat-fed mice (n= 5–11 each). (C) Plasma adiponectin (n=11–13) and (D) WAT mRNA levels (Acrp30) in 16-week-old mice (eight-week-old in the SirBACO::db/db cross). (E) Plasma adiponectin isoform distribution. (F) AMPK phosphorylation in WAT and liver. (G) mRNA levels of adiponectin target genes (n= 4–5 each). (H) FoxO1 acetylation in hepatocytes and (I) Pgc1α acetylation in gastrocnemius muscle. (J–K) Regulation ofAcrp30 mRNA levels in 3T3-L1. *= P<0.05, **= P<0.01. (L) Gene expression in primary mouse hepatocytes (n=4 each).

