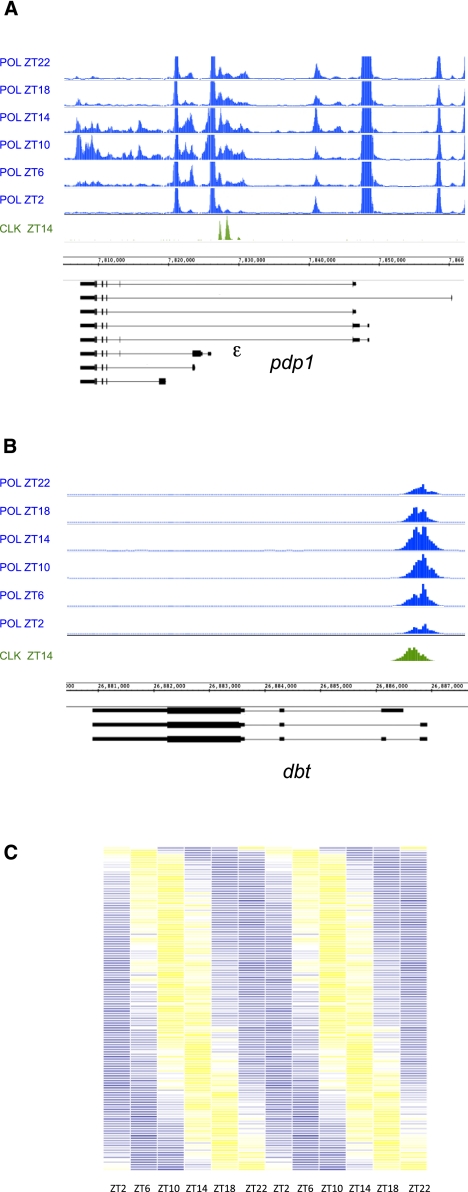
Figure 3.
Approximately 30% of CLK direct target genes have cycling Pol II on their promoters and/or in their coding regions. Pol II ChIP–chips were performed on fly head chromatin collected every 4 h for a total of six time points. (A,B) Pol II binding is visualized on the IGB (Affymetrix). Genes above the genomic coordinates are transcribed from left to right (plus strand), and genes below the genomic coordinates are transcribed from right to left (minus strand). For comparison, CLK binding is shown in green. (A) Pol II occupancy on pdp1 shows both cycling promoter-proximal Pol II binding and cyclical binding of Pol II in the coding region of the circadian-controlled ε isoform. (B) Cyclical promoter-proximal Pol II binding is observed on the circadian kinase dbt. Pol II is always present at the promoter but increases to peak between ZT10 and ZT14. No cyclical Pol II in the coding region is detectable. (C) Heat map showing the Pol II ChIP signal across circadian time on those genes that have overlapping Pol II and CLK peaks (<30% of cycling CLK peaks). Data are double-plotted to aid in the visualization of cycling. Lowest ChIP signal is shown in blue (Z-score −6 to −2), and highest ChIP signal is shown in yellow (Z-score 2–6). Most Pol II peaks oscillate with a phase of ZT10–ZT14. Very few Pol II peaks are maximal at ZT22 or ZT0.

