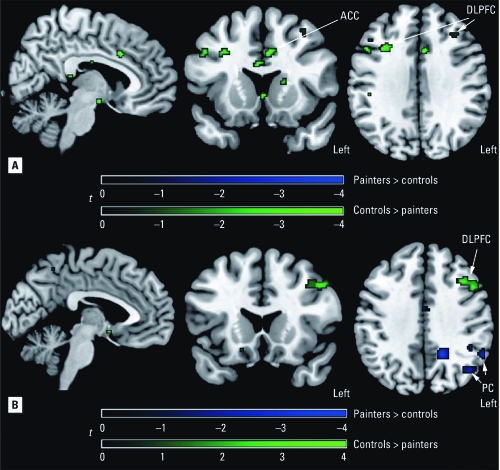
Figure 2.
SPM maps corrected for verbal IQ and lead exposure (A) or corrected for verbal IQ, lead exposure, and task performance (B) of significant group differences (p < 0.001) in activation of the working memory network. Green indicates regions where painters had lower activation and blue indicates regions where painters had higher activation, compared with controls.

