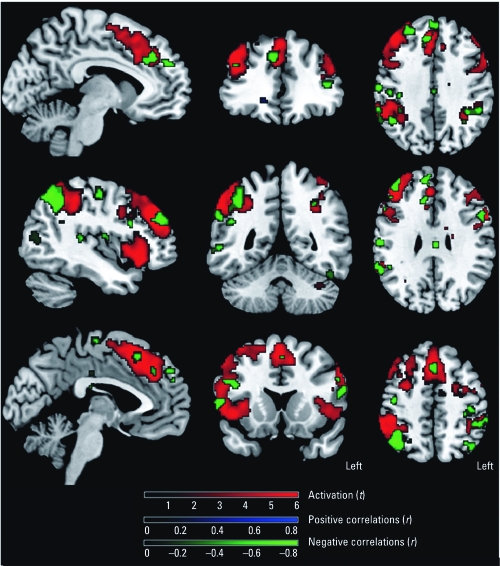
Figure 3.
SPM maps of significant correlations (p < 0.001) between activation and lifetime solvent exposure in painters. Green indicates decreased activation with increased exposure levels (observed in anterior cingulate gyrus, prefrontal cortex, PC, and IC); blue indicates increased activation with increased exposure levels (no significant voxels present); and red indicates general group activation patterns with the N‑Back task.

