Figure 2.
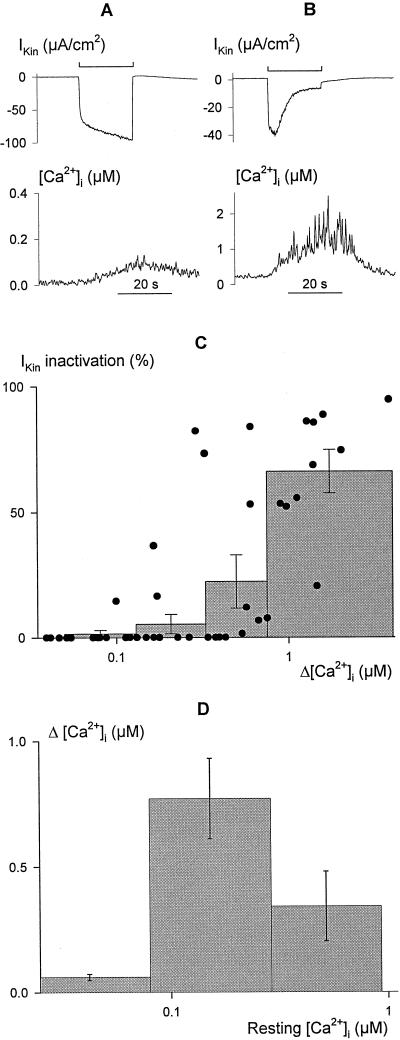
Inactivation of current through IK,in is correlated with [Ca2+]i elevation. Voltage steps of 20 s duration from −50 to −200 mV leading to limited (A) and profound (B) increases in [Ca2+]i (bottom trace, note different scales) in two broad bean guard cells. The clamp current (top trace, note different scales) shows the characteristic time course for IK,in activation (A) in the absence of an extensive rise in [Ca2+]i, and activation followed by a decay in current amplitude (B) with the more pronounced rise in [Ca2+]i. C, Summary of relative IK,in inactivation as a function of the change in [Ca2+]i (Δ[Ca2+]i) evoked by 20-s voltage steps from −50 to −200 mV recorded in 52 independent experiments (solid points). Histograms show the means ± se of measurements binned in successive pools of 10 or 11 experiments. Inactivation of IK,in was calculated from the ratio (Imax − Ifinal)/Imax, with Imax determined at maximum IK,in amplitude and Ifinal taken as the final current amplitude without correction for instantaneous current. Δ[Ca2+]i values were determined from the mean [Ca2+]i recorded over periods of 1 s immediately before and at the end of the voltage steps. Note that the analysis does not account for measurements in which [Ca2+]i was initially high, nor does it account for measurements in which clamp steps yielded little inward current. The distribution is therefore probably skewed to the right along the x axis, but nonetheless shows that current inactivation was associated with the rise in [Ca2+]i. D, [Ca2+]i elevation (Δ[Ca2+]i) after 20-s steps to −200 mV is dependent on the resting [Ca2+]i level. Data from C plotted as a function of [Ca2+]i before voltage steps to −200 mV. Histograms show the means ± se of measurements binned in successive pools with [Ca2+]i ≤ 80 nm, 80 nm < [Ca2+]I ≤ 300 nm, and [Ca2+]I > 300 nm at rest. Note the logarithmic abscissa. The decline in the mean Δ[Ca2+]i from high starting [Ca2+]i values is not consistent with saturation of the Fura-2 signal.

