Figure 4.
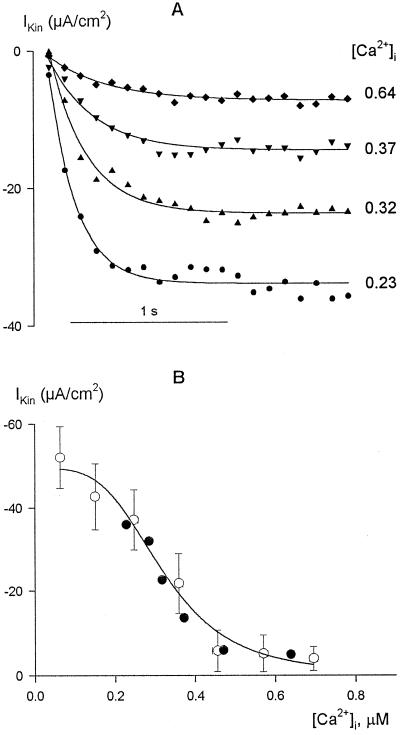
Inactivation of IK,in shows a steep dependence on [Ca2+]i above resting [Ca2+]i levels. A, Data are from one guard cell bathed in 5 mm Ca2+-Mes, pH 6.1, with 10 mm KCl. IK,in recorded during the first 2 s of 20-s steps to −200 mV with [Ca2+]i elevated by successively decreasing the interstep interval from 90 to 20 s. Data fitted to single-exponential activation curves and points are shown at 100-ms intervals for clarity. [Ca2+]i is on the right (in μm). B, Summary of steady-state IK,in from A (solid symbols) along with means ± se of data from 52 guard cells (open symbols) binned in pools of eight to nine experiments with increasing [Ca2+]i. [Ca2+]i values were determined from the mean [Ca2+]i recorded over the final 1 s of voltage steps after prior stimulation to raise [Ca2+]i (see A) or from equivalent measurements from resting [Ca2+]i conditions. The solid line is the result of nonlinear least-squares fitting of the means to the Hill equation (Eq. 1). Fitted parameters: Ki, 329 ± 31 nm; n (cooperativity coefficient), 4.1 ± 0.5. Statistically equivalent results were obtained when the data were fitted without binning (not shown).

