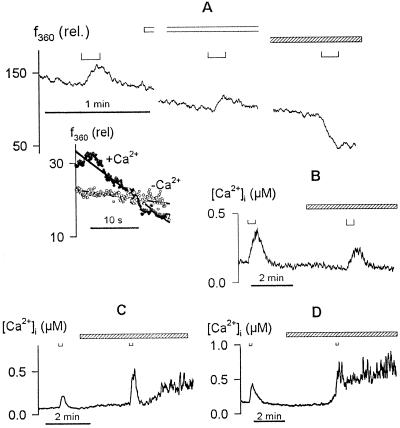
Figure 6.
Evoked [Ca2+]i rise is facilitated by Ca2+ release from intracellular stores. A, Fura-2 fluorescence quenching recorded on f360. Data are from one guard cell recorded after intracellular loading with Mn2+ in 20 mm K+-Mes, pH 6.1, and 2 mm MnCl2. Voltage steps of 20 s to −200 mV (⊔, above) applied with the cell bathed in 20 mm K+-Mes, pH 6.1, plus 2 mm CaCl2, then in the same buffer without CaCl2 (open bar), and finally with 2 mm MnCl2 (striped bar). Inset, f360 during the first 20 s after voltage steps without (○) and with (•) Ca2+ outside after normalizing to the fluorescence signal at the start of each voltage step. Note the rapid decay in f360 after voltage stimulus in the presence of external Ca2+. B to D, [Ca2+]i rise was suppressed by 10 μm ryanodine (B) and augmented by 100 μm heparin (C) and 1 mm neomycin sulfate (D). Data are from three guard cells in 5 mm Ca2+-Mes, pH 6.1, with 10 mm KCl. Membrane voltages were clamped to −50 mV in each case. Voltage steps to −200 mV (B) and −180 mV (C and D) are indicated above (⊔). Times of treatments with ryanodine, heparin, and neomycin sulfate are indicated by the open bars in each case. Note the prolonged secondary rise in [Ca2+]i in the presence of heparin and neomycin sulfate.

