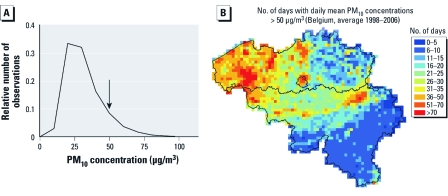
Figure 2.
(A) Frequency distribution of population-weighted daily mean PM10 concentrations in Flanders (Belgium) during the study period (1998–2006). The arrow indicates the EU limit that may be exceeded up to 35 days/year. (B) Spatial distribution of population-weighted daily mean PM10 concentration, expressed as numbers of days with concentration > 50 μg/m3 (map of Belgium; the Flemish region comprises the area north of the black line, excluding the capital region of Brussels in the center of the country).

