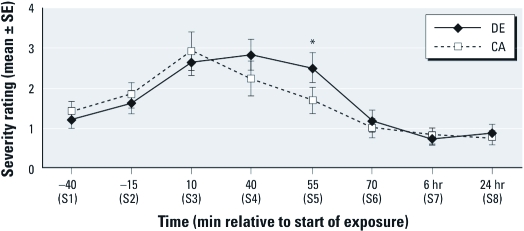
Figure 2.
Mean sickness response symptom severity (± 1 SE) at each measurement time for DE and CA control exposure sessions: 0 (no sensation) to 100 (strongest imaginable). Mean severity is in the “weak” range (1–4); see “Discussion.” Exposure × time interaction for overall change in symptom severity from baseline (–15 min) to times 10, 40, and 55 min was statistically significant (F = 2.97; df = 4, 692; p = 0.019). *p < 0.01 for effect of DE on change in severity from –15 min to time 55 min after the start of exposure.

