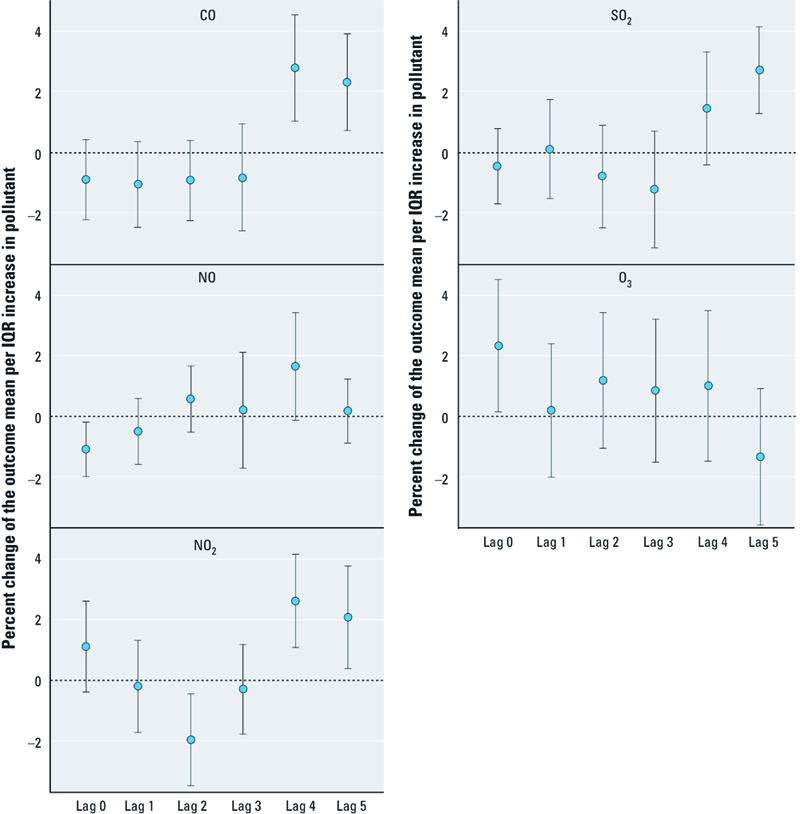
Figure 2.

Percent changes of the mean Lp-PLA2 per IQR (difference between the third and first quartile) in gaseous air pollutants together with 95% CIs in Augsburg, Germany, 14 May 2003 to 24 February 2004.

Percent changes of the mean Lp-PLA2 per IQR (difference between the third and first quartile) in gaseous air pollutants together with 95% CIs in Augsburg, Germany, 14 May 2003 to 24 February 2004.