Fig. 2.
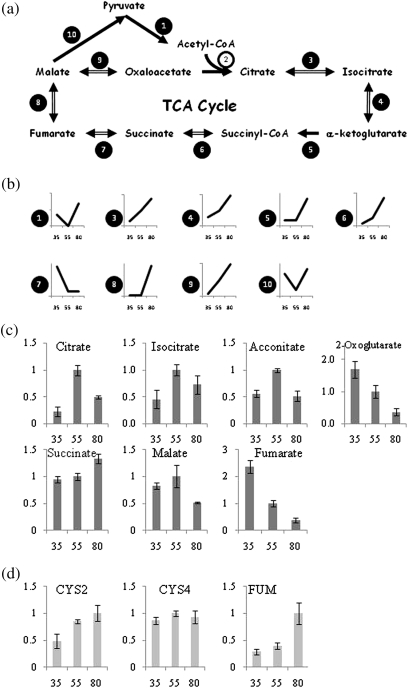
Changes in the TCA cycle during citrus fruit development. (a) TCA cycle. Enzymes that were found to be differentially expressed are numbered with a black background. Enzymes that remained unchanged are numbered with a white background. (1) Pyruvate dehydrogenase. (2) Citrate synthase. (3) Aconitase. (4) Isocitrate dehydrogenase. (5) α-Ketoglutarate dehydrogenase/2-oxoglutarate dehydrogenase. (6) Succinyl-CoA synthetase. (7) Succinate dehydrogenase. (8) Fumerase. (9) Malate dehydrogenase. (10) Malic enzyme. (b) Protein expression changes of the above-mentioned proteins during the transition from early stage II to stage II and from stage II to stage III. The figure shows enzyme changes as a function of development. The x-axis represents the three stages sampled: 35, early stage II; 55, stage II; 80, stage III. The y-axis represents the calculated fold change ratio where stage II was assigned the value 1 and the values in early stage II and stage III were calculated according to the fold change found by dMS. An average of the different isoforms was calculated in cases where different protein isoforms were found (see also Table 1). (c) Relative content of TCA cycle intermediate accumulation was determined during citrus fruit development. Metabolite concentrations were normalized according to the concentration of each metabolite at stage II. (d) Quantitative PCR analysis for citrate synthase genes CYS2, CYS4, and fumarase FUM. The x-axis represents the three developmental stages as described in (b).

