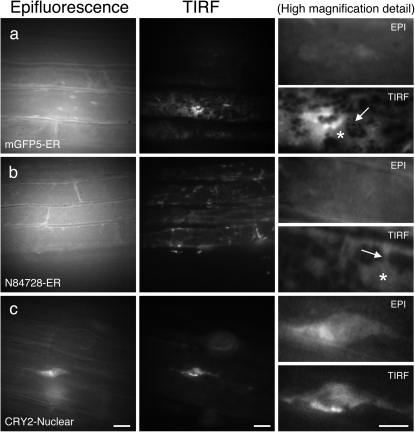
Fig. 3.
Analysis of subcellular organelle markers by epifluorescence and TIRFM in roots. Arabidopsis roots imaged using epifluorescence and TIRFM. (a) mGFP5–ER (ER marker); (b) N84728 (ER marker). Individual ER structures and the presence of extended cisternal lamellae connected to a tubular ER network can only be distinguished in the TIRF images (asterisks, ER cisternae; arrow, ER tubules); (c) N84733 (chromosome marker). Scale bars=10 μm. Scale bars in details=5 μm

