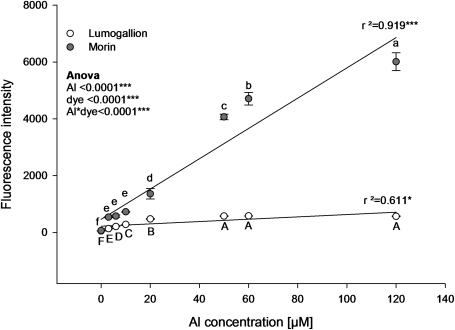
Fig. 3.
Regression analysis of fluorescence intensities of Al–lumogallion and Al–morin complexes at a given dye concentration (30 μM) but varied Al concentrations. Al–lumogallion was measured at pH 5.2 in 0.1 M acetate buffer at excitation and emission wavelengths of 507 nm and 567 nm, respectively. Al–morin was measured at pH 4.8 at excitation and emission wavelengths of 418 nm and 502 nm, respectively. Symbols represent means ±SD, n=4. Morin samples at 50, 60, and 120 μM Al were diluted appropriately to remain in the effective measuring range. Different letters denote a significant statistical difference (Tukey test P <0.05). Upper case letters denote the comparison between different Al–lumogallion fluorescence intensities. Lower case letters denote the comparison between different Al–morin fluorescence intensities.

