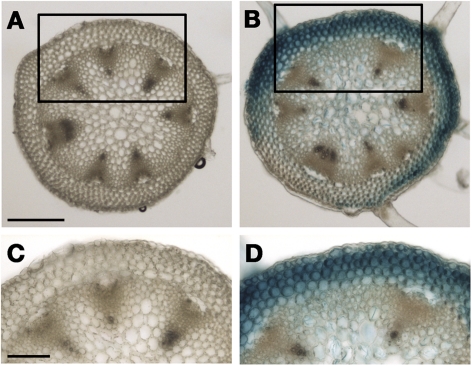
Fig. 3.
Histochemical analysis of GUS expression in cross-sections of inflorescence stems of DR5::GUS transgenic Arabidopsis in response to hypergravity. GUS staining was performed just after the hypergravity treatment. (A) The 1 g control. (B) 300 g. (C and D) Magnifications of areas shown in A and B, respectively. Bars: (A) 200 μm, (C) 100 μm. (This figure is available in colour at JXB online.)

