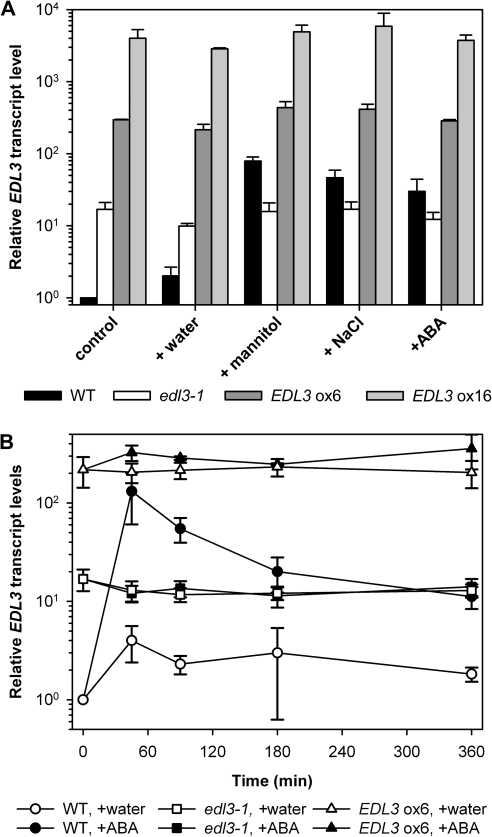
Fig. 1.
Osmotic stress, high salinity, and ABA induce EDL3 expression. EDL3 transcript levels were determined by quantitative RT-PCR. Results of experiments were first normalized according to the constitutively expressed ACTIN1 (AT2G37620) gene. Normalized expression values were then used to calculate fold induction with respect to untreated wild-type samples for which values were set to 1. Data represent the mean of three independent biological replicates ±SE. (A) Expression profiles of EDL3 in response to osmotic stress, high salinity, and ABA application. Seedlings were grown on moist filter paper under continuous white light for 4 d and then transferred to distilled water (control), 5 μM ABA, 450 mM mannitol, or 150 mM NaCl for 2 h before harvesting. (B) Temporal pattern of EDL3 transcript accumulation upon ABA treatment. After stratification seedlings were grown under a 12/12 h light/dark cycle for 4 d. Plants were transferred to new plates containing distilled water or 5 μM ABA at the onset of the light phase at the beginning of day 5. Samples were harvested at indicated time.

