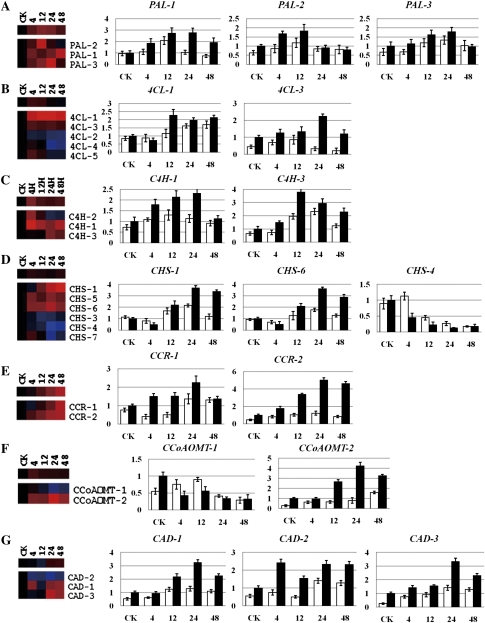
Fig. 7.
Detailed expression profiles of genes in the major lignin biosynthetic pathway. The relative expression level was obtained by RNA-Seq after taking the equation and logarithmic transformations of TPM, and also by qPCR for data verification. White and black columns refer to G. hirsutum (susceptible) and G. barbadense (resistant), respectively. Error bars represent the SD for three independent experiments, and three technical replicates were analysed. CK, 4, 12, 24, and 48 on the x-axis refer to control and 4, 12, 24, and 48 h after inoculation with V. dahliae. The y-axis represents the relative expression level. (A) PAL, phenylalanine ammonia-lyase; (B) 4CL, 4-coumarate:CoA ligase; (C) C4H, cinnamate 4-hydroxylase; (D) CHS, chalcone synthase; (E) CCR, cinnamoyl CoA reductase; (F) CCoAOMT, caffeoyl-CoA O-methyltransferase; (G) CAD, cinnamyl alcohol dehydrogenase.

