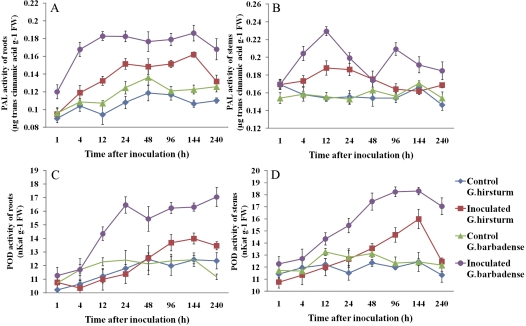
Fig. 8.
Enzyme activity in roots and stems of both control and inoculated susceptible and resistant cotton plants at different time points after inoculation. (A) PAL, roots; (B) PAL, stems; (C) POD, roots; (D) POD, stems. Error bars represent the SD for three independent experiments. (This figure is available in colour at JXB online.)

