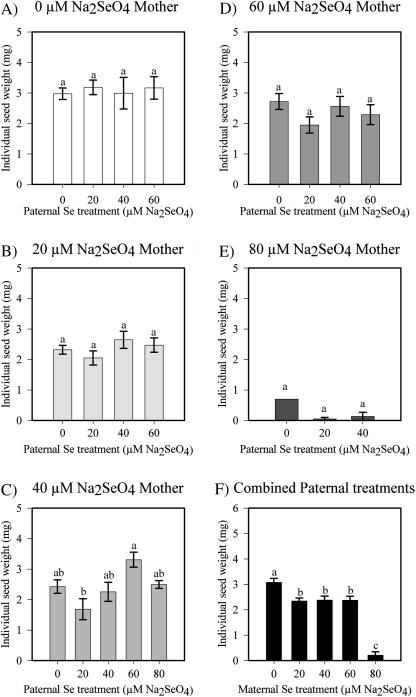
Fig. 3.
Average individual seed weight (mg) from crosses of B. juncea parents treated with 0, 20, 40, 60, or 80 μM Na2SeO4. A–E each represent plants from one maternal Se treatment that were pollinated with paternal plants that received different Se levels. F shows the average for each maternal Se treatment when all paternal Se treatments are pooled. Values are means ±SE; a different letter above the bars represents a significant difference (α=0.05). See Supplementary Table S1 at JXB online for details on the number of seeds weighed.

