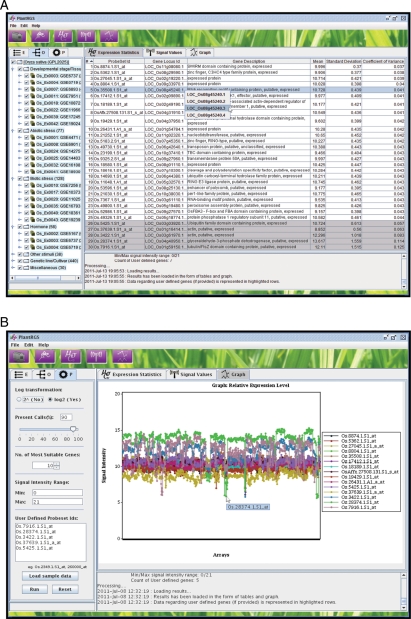
Figure 1.
Screenshots of PlantRGS showing results. (A) Screenshot of the results in expression statistics tab showing the list of the most suitable reference genes (probeset ids) predicted by PlantRGS and user-defined probesets (highlighted in grey colour) with their gene locus ID, gene description, mean signal value, standard deviation and CV. (B) Screenshot of the graph tab showing the relative expression levels of all the reference genes predicted by PlantRGS and user-defined probesets in all the arrays (samples/experimental conditions).

