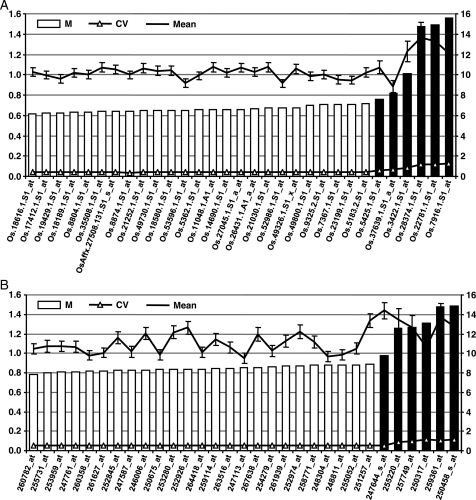
Figure 2.
Validation of the results obtained by PlantRGS for whole data set of rice (A) and Arabidopsis (B). The expression stability (M, represented by bars) of top 25 novel reference genes predicted by PlantRGS (open bars) and five traditionally used reference genes (black bars) were calculated by geNorm in all the arrays/experiments available for rice and Arabidopsis. A lower value of M (scale on left axis) indicates higher expression stability. The line with triangles indicates CV for each gene (scale on left axis), and the line with points indicates mean signal intensity (scale on right axis) with standard deviation (error bars).

