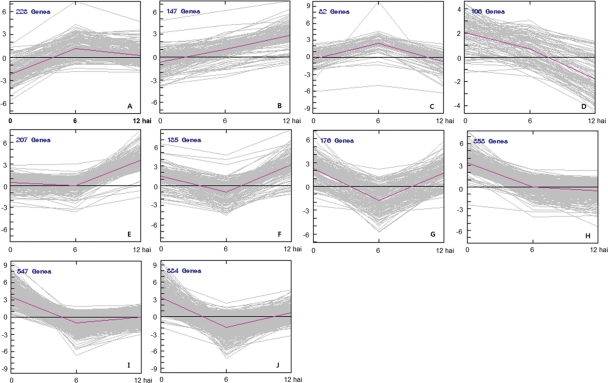
Figure 3.
Cluster analysis of 2415 genes differentially expressed following Xag inoculation. The genes were classified based on similarity of expression pattern over the time course of infection. Ten clusters were identified by K-means clustering. The pink lines indicate representative transcriptional regulators; x- and y-axes represent hours after Xag inoculation (hai) and log2 fold change [log2 (BLP-resistant NIL/BLP-susceptible NIL)], respectively.

