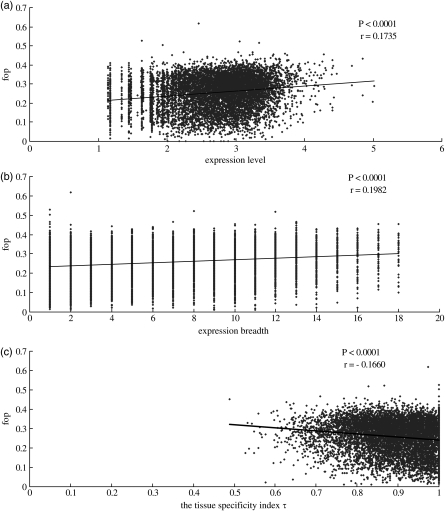
Figure 3.
Scatter plots of Fop versus expression level, expression breadth and the tissue specificity index τ. Expression data on 8631 genes for 18 tissues, blood, brain, bursa of fabricius, cecum, connective tissue, embryonic tissue, epiphyseal growth plate, gonad, head, heart, limb, liver, muscle, ovary, pancreas, spleen, testis and thymus, were taken into account. Expression level is defined as the total expression level of a gene, which is the sum of the total 18 tissues' EST (transformed to logarithm with base 10). Expression breadth defined as the numbers of tissues in which EST was found. The calculation of τ can be seen from materials and methods. (a) Fop versus expression level; (b) Fop versus expression breadth and (c) Fop versus the tissue specificity index τ.

