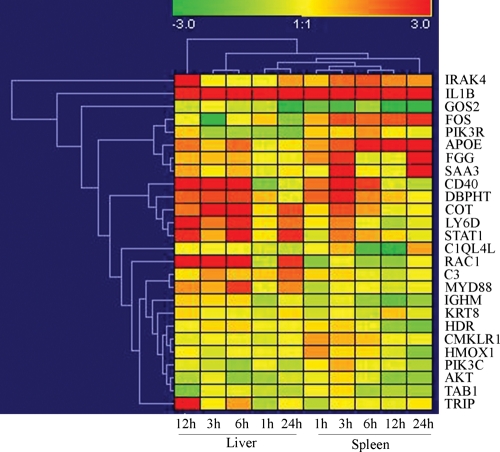
Figure 4.
Temporal and spatial expression patterns of 26 immune-related genes in the spleen and liver revealed by qRT–PCR, Real-time PCR was used to examine gene expressions in the liver and spleen of Asian seabass challenged with V. harveyi. Samples were collected at 1, 3, 6, 12 and 24h post-injection. Relative gene expression changes are shown on a natural logarithmic scale, and the values represent the mRNA expression changes after challenged with V. harveyi relative to a control samples at each point of sampling time and tissue. Red color represents increasing level of the gene expression and blue color indicates decreasing of the gene expression after challenging with V. harveyi at the respective time and tissue.

