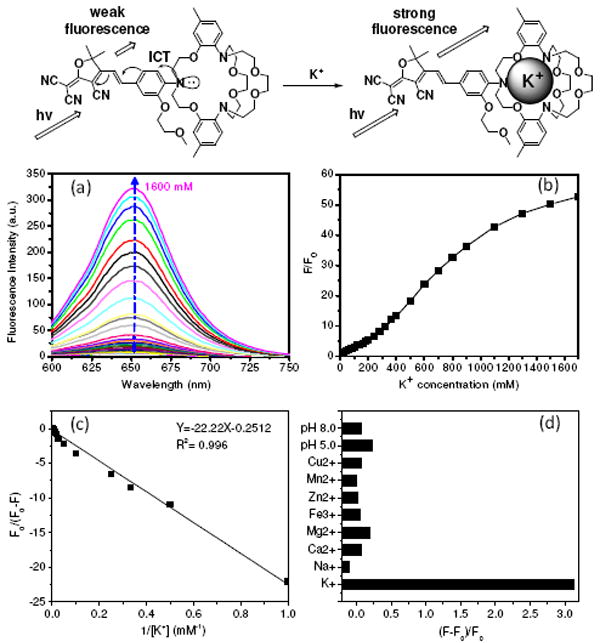
Figure 1.

(a) Fluorescence change of KS2 in HEPES buffer (pH 7.2) containing different KCl concentrations, excited at 561 nm. (b) Changes of fluorescence intensities at 650 nm at different K+ concentrations. F is the fluorescence intensity at various conditions. F0 is the emission intensity before the titration (with 0 mM K+). (c) Benesi-Hildebrand plot of KS2. (d) Fluorescence intensity change of KS2 in the presence of various biological cations at their physiological concentrations [K+ (150 mM), Na+ (15 mM), Ca2+ (2.0 mM), Mg2+ (2.0 mM), Zn2+ (2.0 mM), Fe3+ (50 μM), Mn2+ (50 μM), and Cu2+ (50 μM)] and different pH values [pH (5.0) and pH (8.0)].
