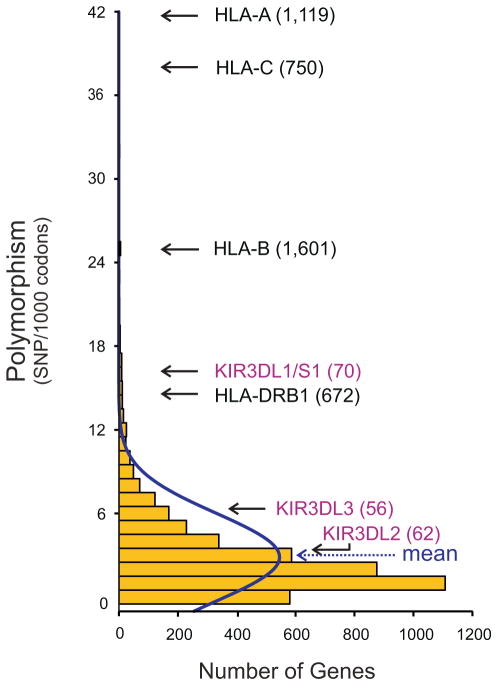
Figure 2. KIR3DL1/S1, like HLA-A, B, C and HLA-DRB1, is one of the most highly polymorphic human genes.
Shows comparison of coding-sequence diversity in the genomes of two Asian individuals. For the four alleles of each gene the number of single nucleotide polymorphisms (SNP) normalized to the number of codons in the gene. These values are presented in a histogram (yellow bars) and a continuous distribution (blue line). The genes form a normal distribution, with KIR3DL1/S1, HLA-A, B, and C, and HLA-DRB1 being outliers. For the named genes, the number of allotypes described worldwide is in parentheses (112, 53). Although KIR3DL2 and KIR3DL3 have many alleles, they differ by one or a few substitutions. Per-gene summary statistics were from Wang et al. 2008 (113) and Kim et al. 2009 (114), and analyzed using ‘Statistica software version 8’.

