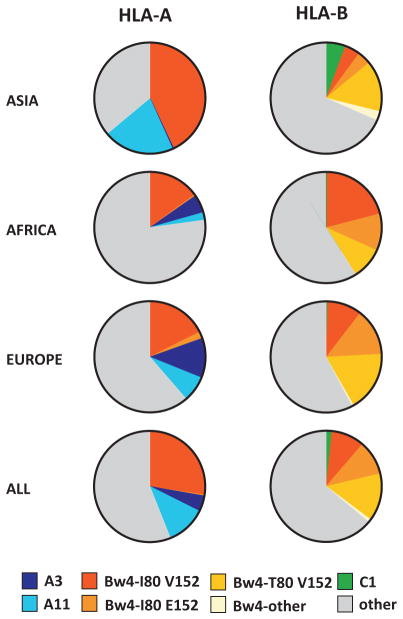
Figure 3. Distribution of HLA-A and B epitopes recognized by KIR in human populations.
Each pie represents the HLA-A or HLA-B allotypes in a population. Subdivisions within each pie are colored according to the epitope recognized by KIR, or shaded grey if they do not engage KIR. The A3/11 epitope is subdivided into A3 and A11, the Bw4 epitope is subdivided according to polymorphisms at positions 80, within the Bw4 sequence, and 152 that influence the avidity of Bw4 for KIR (115). HLA frequencies for representative Asian [n=24], African [n=13] and European [n=10] populations were obtained from http://www.allelefrequencies.net (116)

